
The Securities and Exchange Commission supports data visualization to help people better understand financial disclosures. This support shows a growing trend as companies now use more qualitative and quantitative infographics in their financial reports.
Data visualization turns complex financial information into clear charts, graphs, and diagrams. This helps insiders and stockholders understand the data better, especially when dealing with large amounts of information. Financial institutions can analyze their customer’s data to spot high-value clients and predict future trends. These insights lead to better strategic choices. Visual tools also help professionals detect patterns and outliers that raw data might hide.
You’ll find that data visualization tools maximize returns through quick decision-making. They also help monitor risks and recognize patterns in financial markets more effectively.
Core Benefits of Data Visualization Tools in Finance
“The purpose of visualization is insight, not pictures.” — Ben Shneiderman, American computer scientist, founding director of the Human-Computer Interaction Laboratory
Financial institutions worldwide have found that there was a substantial improvement in their operational efficiency with data visualization tools. According to Financial Times research, companies using data visualization tools report a 40% improvement in decision-making speed and accuracy.
30% Faster Decision Making with Visual Analytics
Visual analytics helps teams process complex datasets without cognitive overload, which leads to faster and more accurate decisions. BlackRock’s data accessibility improved by 40% through visualization tools, and portfolio managers now make informed decisions using up-to-the-minute data analysis. Deloitte showed this effect by cutting data analysis time by 30%, which allowed teams to focus on strategic initiatives.
Real-time Risk Monitoring Capabilities
Visualization tools with up-to-the-minute monitoring provide these essential capabilities:
- Dynamic dashboards display live data feeds for immediate threat detection.
- Automated alerts trigger when risk thresholds are breached.
- Customizable interfaces enable interactive exploration of risk factors.
Teams can spot and fix problems before they affect operations with up-to-the-minute visualization that helps ensure data quality. Moreover, financial institutions use visualization tools to identify risks in loan approval decisions and uncover portfolio concentration risks.
Enhanced Pattern Recognition in Market Data
Data visualization turns complex financial data into applicable information through pattern recognition. Technical analysts predict future price movements using chart patterns as indicators, and specific formations like head and shoulders, triangles, and double tops serve as valuable predictive tools. Research supports that chart patterns in technical analysis provide measurable predictive value.
Pattern recognition proves useful beyond trading. Portfolio managers use up-to-the-minute dashboards to measure portfolios and compare performance metrics. Visualization helps decision-makers quickly identify potential risks and assess alternative strategies, which improves the reliability and accuracy of financial forecasts.
Essential Data Visualization Charts for Financial Analysis
Picking the right visualization tools is crucial for effective financial analysis. Three chart types give deep insights into financial data.
Time Series Charts for Stock Performance
Time series charts are the foundation for tracking stock price movements and market trends. These charts use lines to connect data points that show financial metrics over time. Analysts use these visualizations to spot long-term trends, seasonal patterns, and market opportunities. Time series analysis helps predict stock prices by examining historical values and their patterns.
Heat Maps for Risk Assessment
Heat maps turn complex risk data into a color-coded matrix that helps quickly spot potential threats. These visual tools show risk likelihood on the horizontal axis and effect on the vertical axis. The color gradient – typically red, yellow, and green – represents different risk levels:
- Red zones show critical threats that need immediate attention.
- Yellow areas point to moderate risks that need caution.
- Green sections mark low-priority risks with minimal effect.
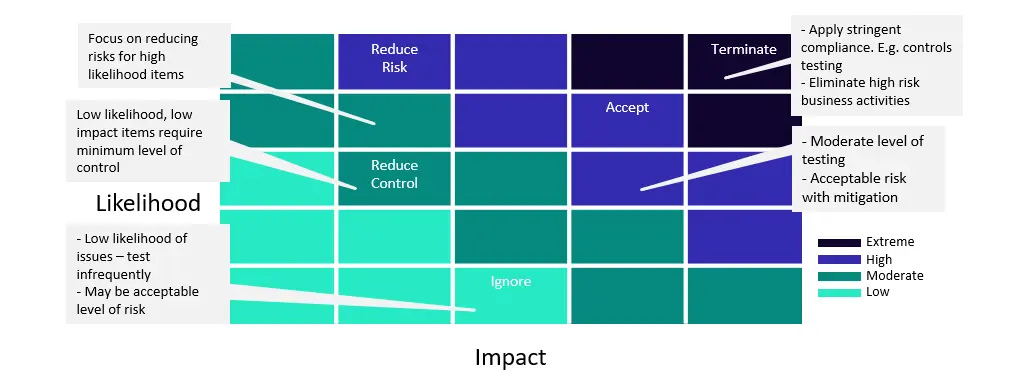
Heat maps help organizations see customer concentrations, spot regional infrastructure problems, and find ways to cut logistics costs.
Candlestick Patterns for Trading
Candlestick charts, which came from 18th-century Japan, are vital tools for modern trading analysis. Each candlestick has three key parts that show market sentiment:
- The body shows the open and close values.
- The upper shadow marks the highest price of the period.
- The lower shadow indicates the lowest price of the period.
The candlesticks’ colors show price direction – green bodies mean price increases, while red bodies show decreases. These patterns help traders spot potential market reversals and continuations. Candlestick patterns are complex but give great insights into market psychology and price movements, making them essential for technical analysis.
Building Effective Financial Dashboards
“Data visualization should always stand on the shoulders of data understanding and data literacy. Once you have an accurate understanding of the data, you can start considering questions such as: “What chart should I choose?” or “What color should I use?” or “How will my audience perceive the visualizations?”” — Cole Nussbaumer Knaflic, Data visualization expert and author of ‘Storytelling with Data’
A good financial dashboard needs the right data and visual elements. Users can quickly see key metrics and relevant data customized to their needs.
Key Performance Indicator Selection
The right financial KPIs create the foundation of a working dashboard. Companies with well-designed dashboards see a 6% increase in revenue within three months and reach 90% adoption. Your first step is to pick metrics that directly affect your goals and give practical insights. Keep the focus on information that helps make decisions instead of overwhelming users with too much data.
These criteria will help you pick the most relevant KPIs for your financial dashboard:
- Pick metrics based on strategic value and measurable effects.
- Choose KPIs that match specific department needs.
- Look for indicators that show trends over time.
- Add metrics for live monitoring.
- Choose data points that help meet compliance rules.
Layout Optimization Techniques
Dashboard element placement affects how well users understand and use the information. The most important metrics should appear in the top left corner because users look there first. Your layout should follow an inverted pyramid, showing high-level metrics at the top with details below.
White space plays a key role in making dashboards work. It acts as a design element that makes content more readable and creates visual hierarchy. The dashboard should show all key information on one screen. Users should learn key insights within five seconds.
Keep your dashboard limited to five to nine key metrics for visual clarity. This limit helps users quickly understand the data’s story without feeling lost. Related metrics should be grouped with consistent visual elements to make comparison and analysis easier.
A financial dashboard works best when it shows complex information in a clear format. Regular updates keep the dashboard relevant and useful. Your dashboard can become a powerful financial decision-making tool with the right KPIs and thoughtful layout.
Data Visualization Implementation Strategy
Data visualization needs a strategic approach that combines the right technology, skilled teams, and careful budget allocation. Organizations must build a strong foundation to ensure successful deployment of visualization tools in their financial operations.
Technology Stack Requirements
We relied on API-enabled data aggregation in a modern finance tech stack to eliminate data silos and create unified access points. The core technical requirements has:
- Cloud-native software for flexible implementation.
- API integration capabilities for connecting payment platforms.
- Immediate data consolidation tools.
- Automated reporting systems.
- Security protocols for data protection.
Without doubt, cloud-based solutions are a great way to get flexibility and cost optimization. Organizations should give priority to tools that enable automated data consolidation and restructuring to streamline budget formulation processes during implementation.
Team Structure and Skills
A balanced team composition ensures successful data visualization implementation. Research shows that 60% of agile finance leaders rate their team’s visualization abilities as excellent, compared to only 24% of their peers. The optimal team structure has:
- Analytics engineers for data transformation.
- Data analysts for interpretation.
- Visualization specialists for dashboard creation.
- Business intelligence experts for strategic insights.
- Technical specialists for system integration.
Strategic collaborations with specialized firms help manage infrastructure and data governance, which reduces the burden on internal teams.
Budget Planning Framework
Budget allocation for data visualization needs a careful assessment of multiple factors. The framework should balance investments across people, processes, and technology. A strategic approach has:
- Original Assessment
- Audit current data infrastructure
- Identify inefficient spending areas
- Assess existing software licenses
- Resource Allocation
- Invest in flexible visualization tools
- Allocate funds for team training
- Reserve budget for external expertise
Organizations can expect improved efficiency through automated data consolidation after implementation. Notwithstanding that, success needs ongoing investment in team development and tool optimization. Whatever the organization size, the budget framework should prioritize quick wins that demonstrate value while building toward long-term capabilities.
Measuring ROI from Data Visualization
Companies need to measure their data visualization investments across multiple dimensions. A study by Nucleus Research shows that companies earned $48.73 for every dollar spent on data visualization.
Cost Reduction Metrics
Data visualization helps track operational efficiencies and resource optimization. Companies that use advanced visualization tools see a 10% drop in costs. The process starts by setting baseline metrics in these areas:
- Supply chain and procurement savings.
- Cost savings from predictive maintenance.
- Smart staffing through data analysis.
- Faster data processing.
- Lower error rates in financial operations.
The McKinsey Global Institute found that companies using data analytics are 23 times more likely to win new customers and 19 times more likely to be profitable.
Performance Improvement Indicators
Evidence-based metrics show the real value of investing in data visualization. Companies that use visual analytics see 40% better data access. The benefits show up in several key areas:
- Decision-Making Speed
- Teams analyze data 30% faster
- Customer retention rates are 6 times higher
- Market changes get faster responses
- Operational Efficiency
- Revenue grows 10% through better operations
- Key processes take less time
- Resources get used more effectively
- Risk Management
- Better fraud detection
- Smarter portfolio risk assessment
- Better compliance monitoring
Companies must compare their progress against set standards when looking at cost savings or performance gains. Companies using these tools report better financial forecasts and smoother operations. These tools also help track customer value and satisfaction scores, which proves their worth.
The Retail Analytics Council found retailers using data visualization got two benefits – they cut costs by 10% while growing revenue by 10%. This shows both quick wins and lasting value from visualization investments.
Companies need solid measurement systems to justify spending on visualization tools. Good implementation needs ongoing resources, so tracking these numbers helps keep stakeholders confident and creates lasting value.
Common Implementation Challenges
Organizations lose an average of SAR 56.19 million annually due to poor data quality. This highlights why solving the problems of data visualization project implementation is crucial. Many organizations struggle to implement visualization tools in their financial operations, despite clear benefits.
Data Quality Issues
The biggest problem in financial visualization implementations is data quality. Organizations struggle with seven key data quality challenges:
- Incomplete or missing information
- Duplicate entries in databases
- Inconsistent data formats
- Outdated records
- Data integrity problems
- Security vulnerabilities
- Privacy compliance concerns
Global data decays at a rate of 3% monthly. Financial institutions need robust data validation processes to stay accurate. Citibank’s SAR 1872.96 million penalty for data governance issues shows how small errors can lead to major setbacks.
Integration with Legacy Systems
Legacy system integration creates technical hurdles for financial institutions. Banks use various software systems that have built up over time. Each system has its own data storage methods. These disconnected systems create information silos that block a complete business view.
Key integration challenges include:
- Teams can’t collaborate well because of data silos.
- Custom solutions need special expertise.
- Data reconciliation happens manually.
- Old hardware and software cost too much to maintain.
- Vendor restrictions limit options.
Marketing departments alone use 11 to 20 different tools that don’t connect. API-enabled data aggregation helps organizations eliminate these silos and create single access points.
User Adoption Barriers
Employee use of analytical tools has barely grown in the last seven years. Users often don’t know what questions to ask or which data matters to their needs.
Research shows several reasons for low adoption:
- 50% need better training
- 41% worry about data quality
- 36% face budget limits
- 33% find tools hard to use
Business analysts often miss key insights. This makes dashboards less useful for exploration and live decision-making. Organizations can overcome these challenges by:
- Delivering reliable data quickly.
- Creating data governance frameworks.
- Setting up data quality rules and workflows.
- Tracking data quality metrics.
- Working with source system owners.
Financial institutions can implement these tools successfully with good planning and execution. Success depends on certified reports, strong data governance, and complete training programs.
Conclusion
Data visualization is the life-blood of technology that reshapes the scene of how financial institutions analyze, present, and act on complex data. Organizations can make decisions 30% faster with advanced visualization tools that boost risk monitoring and pattern recognition capabilities.
Visualization investments give financial institutions impressive returns, averaging $48.73 for each dollar spent. These tools work best with time series analysis, heat maps, and candlestick patterns. Teams can spot market trends and manage risks better.
Your success requires careful planning of technology, team structure, and budget allocation. Data quality problems and integration challenges exist, but proper planning leads to better operations and lower costs.
Make use of your financial data’s full potential with Alnafitha IT’s Data & Analytics Services. Our experts help financial institutions turn raw data into useful insights. We help you make better decisions and boost ROI through advanced data visualization solutions.
Financial data visualization keeps evolving with new opportunities for institutions that welcome these powerful tools. The right visualization methods, quality data, and proper team training are the foundations of your success in today’s digital world of finance.